
Should-Cost Analysis Guide
Learn should-cost analysis methodology to understand fair market pricing. Build cost models to strengthen negotiation position and validate vendor proposals.
Rhea Kapoor
Head of Procurement Research, SpecLens
- 850+companies trust SpecLens
- 99%extraction accuracy
- 8 hrssaved per comparison
- AES-256encrypted · GDPR compliant
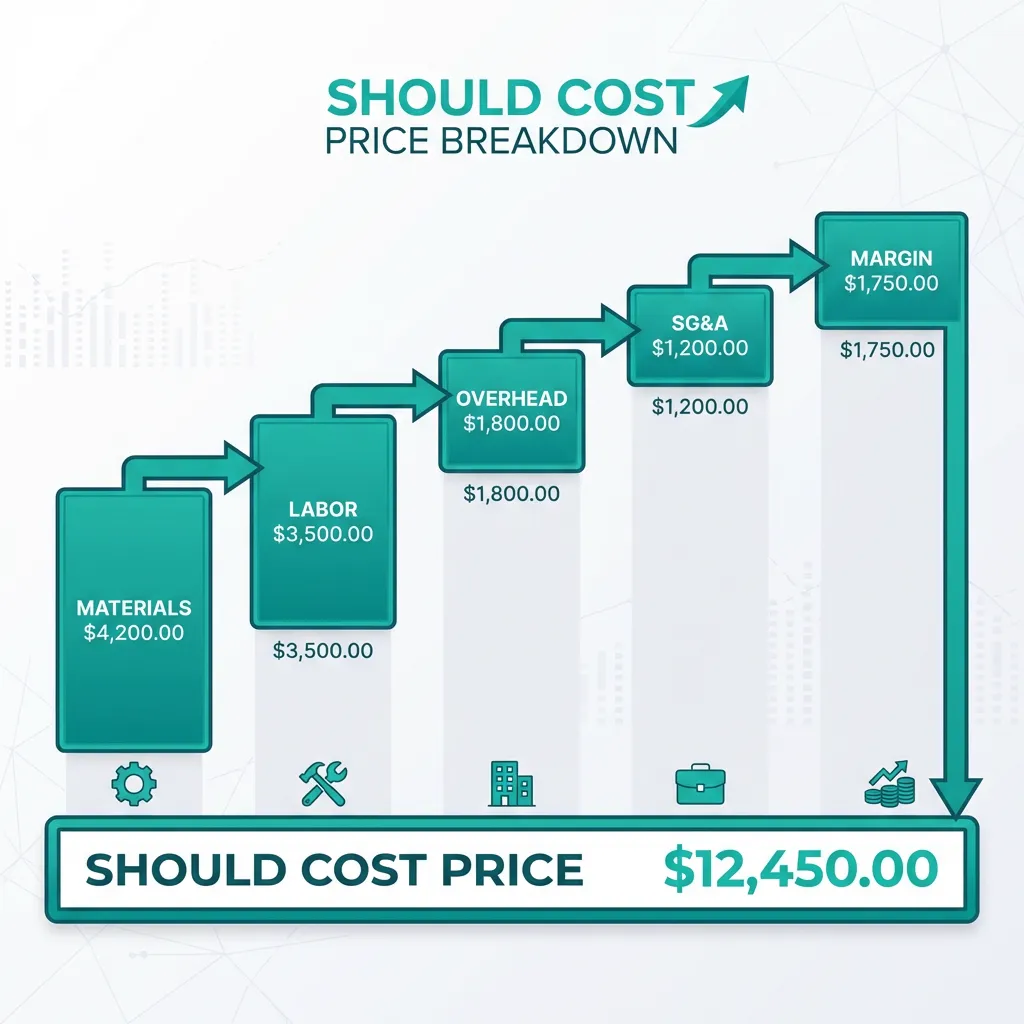
What's a fair price? Not what vendors quote—but what something should actually cost based on its components, labor, overhead, and reasonable margin. (For full lifecycle costing, see our TCO Calculator Guide; for the universe of overlooked line items, 15 hidden procurement costs.)
Should-cost analysis builds independent cost estimates before negotiating—shifting power from "take it or leave it" to data-informed negotiation. Apply the output in our vendor negotiation strategies; for custom-manufacturing categories where quote variance is highest, see why <25% of custom manufacturing quotes are accurate.
What is Should-Cost Analysis?
| Component | What It Includes | Typical % |
|---|---|---|
| Direct materials | Raw materials, components, packaging | 30-60% |
| Direct labor | Production and assembly time | 10-25% |
| Manufacturing overhead | Facility, equipment, utilities | 10-20% |
| SG&A | Sales, admin, R&D | 10-20% |
| Profit margin | Vendor's reasonable return | 5-15% |
Why Should-Cost Matters
| Without Should-Cost | With Should-Cost |
|---|---|
| Accept vendor pricing as given | Challenge specific cost elements |
| Limited negotiation leverage | Data-backed position |
| Opaque cost structure | Transparent understanding |
| Hope for "good deal" | Know what "good" means |
When to Use Should-Cost
| High-Value Uses | Lower Priority |
|---|---|
| Major purchases, recurring contracts | One-time purchases |
| Categories bought regularly | Highly differentiated products |
| Vendor pricing concerns | Small dollar value |
| Strategic supplier relationships | Spot purchases |

Building a Cost Model
Step 1: Define the Product/Service
Document detailed specifications, bill of materials, process steps, volume requirements, and quality requirements.
Step 2: Identify Cost Elements
- Direct Materials: Raw materials, purchased components, packaging
- Direct Labor: Operations, time per operation, skill level
- Overhead: Facility costs, equipment depreciation, utilities
- SG&A: Sales costs, administrative overhead
- Margin: Industry-typical profit margins
Step 3: Gather Cost Data
| Cost Element | Data Sources |
|---|---|
| Raw materials | Commodity indices (LME, COMEX), supplier quotes |
| Components | Distributor pricing, manufacturer MSRP |
| Labor | Bureau of Labor Statistics, industry surveys |
| Overhead | Industry ratios, public company data |
| Margin | Public company financials, industry analysis |
Example Calculation
| Cost Element | Calculation | Amount |
|---|---|---|
| Steel (2.5 kg @ $1.20/kg) | 2.5 × $1.20 | $3.00 |
| Electronics module | Market price | $45.00 |
| Other materials | Various | $12.00 |
| Direct Materials | $60.00 | |
| Labor (0.5 hr @ $30/hr) | 0.5 × $30 | $15.00 |
| Overhead (50% of labor) | $15 × 0.5 | $7.50 |
| SG&A (15% of above) | $82.50 × 0.15 | $12.38 |
| Profit (10% margin) | $94.88 × 0.10 | $9.49 |
| Total Should-Cost | $104.37 |
Using Should-Cost in Negotiation
✅ Better Approach
Avoid: "Your price is too high."
Use: "Based on current steel prices and standard manufacturing overhead ratios, we estimate production cost at approximately $X. Can you help us understand the gap between that and your quoted price?"
Handling Vendor Responses
| Vendor Response | Your Counter |
|---|---|
| "Our quality is higher" | Help us understand specific quality differences and cost impact |
| "Materials cost more" | Share your current material costs so we can update our model |
| "R&D/innovation included" | What's the reasonable R&D allocation for this product? |
| "Our margins are competitive" | What margin does your pricing reflect vs. industry benchmarks? |
Model Accuracy Expectations
| Level of Detail | Typical Accuracy |
|---|---|
| High-level estimate | ±25-35% |
| Detailed model | ±15-25% |
| Engineering estimate | ±10-15% |
| Full breakdown with verification | ±5-10% |
Key Insight: The goal isn't precision—it's informed understanding of cost structure. Even rough models dramatically improve negotiation positioning.
Know What You Should Pay
Should-cost analysis transforms negotiation from guesswork to data-informed discussion. Build your models, understand cost drivers, and negotiate from knowledge — and standardize the response intake with our Quote Comparison Template.
Free TCO Calculator → | Hidden Costs Guide → | Capital Equipment TCO →
Frequently Asked Questions
Related Articles
Should-Cost vs TCO vs Bid Leveling: A Sourcing Decision Tree
Three procurement methodologies, three different questions. Should-cost models what a product *should* cost; TCO models lifecycle cost across vendors; bid leveling normalizes received bids onto the same scope. The decision tree for picking the right one.
15 Hidden Procurement Costs
Discover hidden procurement costs that blow your budget. Learn to identify installation, training, maintenance, and overlooked expenses.
Free TCO Calculator + Complete Guide (2026)
Use our free TCO calculator to compare vendor costs. Includes the TCO formula, hidden cost checklist, and real industry examples.
Vendor Negotiation: 6 Strategies for 2026
Negotiate better deals with suppliers using these 6 proven strategies. Save costs, secure better terms, and build stronger vendor relationships.