Vendor Datasheet Comparison Methods
Learn effective vendor datasheet comparison methods. Transform PDF datasheets into structured side-by-side comparisons.
Priya Sharma
Procurement Technology Lead, SpecLens
- 850+companies trust SpecLens
- 99%extraction accuracy
- 8 hrssaved per comparison
- AES-256encrypted · GDPR compliant
Key takeaways
- Compare datasheets on a normalized matrix: one row per spec, one column per vendor, all values converted to common units.
- Verify specs are measured under the same test conditions — '95% efficiency' means nothing without knowing load and temperature.
- Compare 3-5 vendors in depth for procurement decisions; more than 5-7 creates diminishing returns and supplier-relations cost.
- Vendor datasheets are starting points, not verified facts — for high-stakes purchases, require third-party test reports or certifications.
- Manual datasheet comparison takes 30-60 minutes per vendor; AI tools complete the same analysis in minutes with better consistency.
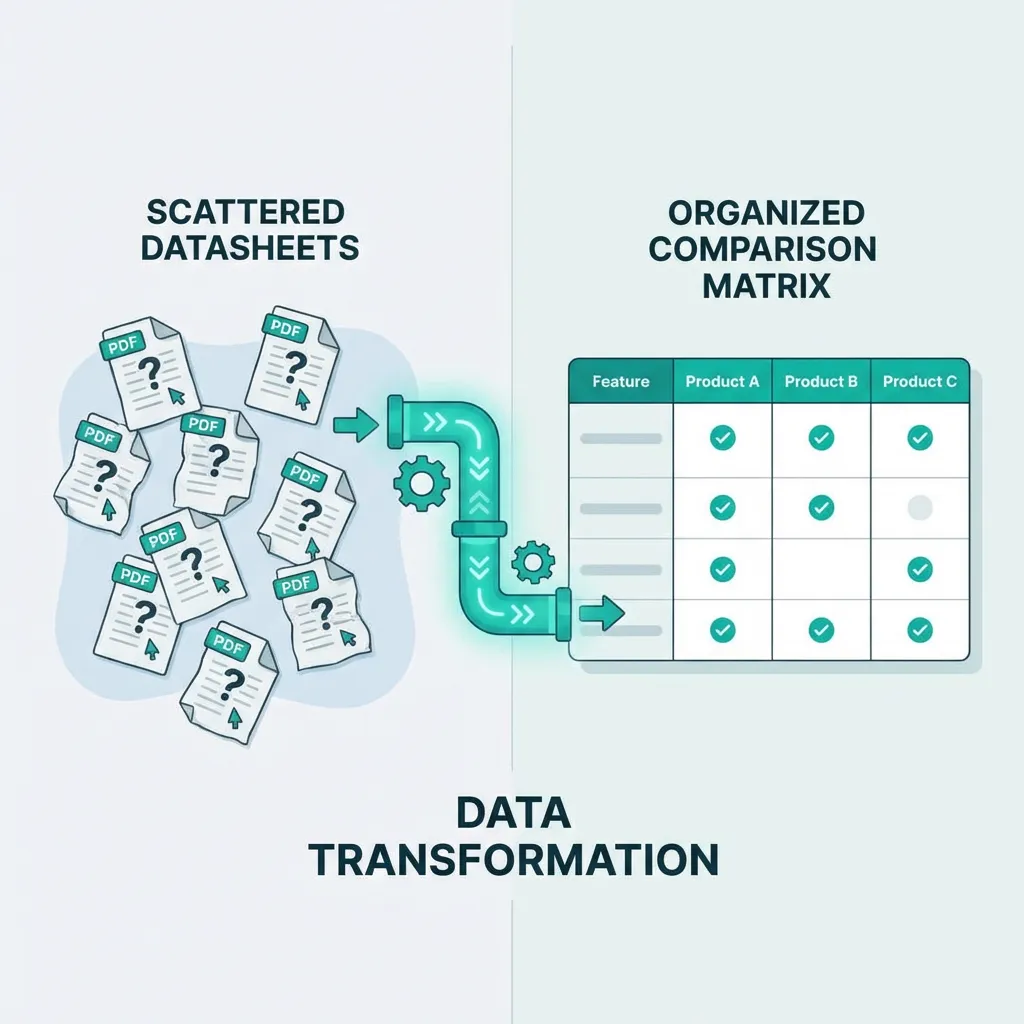
You have datasheets from five vendors. Each uses different formats, terminology, and units. Comparing them means hours of manual work—and the risk of missing critical differences. (For the broader process, see our guide to comparing product specifications.)
Effective datasheet comparison is essential for objective vendor selection. This comprehensive guide shows you how to transform scattered PDFs into structured side-by-side analysis — pair it with our specification gap analysis guide to catch what's missing.
The Datasheet Comparison Challenge
What You're Dealing With
| Variation | Example |
|---|---|
| Format | PDFs, web pages, Excel, print brochures |
| Structure | Different section orders, varying completeness |
| Terminology | Same spec, different names |
| Units | Inches vs. millimeters, PSI vs. bar |
| Presentation | Marketing emphasis vs. technical detail |
| Completeness | Some specs present, others missing |
Why Comparison Is Difficult
| Challenge | Impact |
|---|---|
| Different formats | Can't overlay or directly compare |
| Terminology variations | Same thing called different names |
| Missing specifications | What's not stated may matter |
| Unit differences | Can't compare without conversion |
| Marketing spin | Claims without supporting data |
| Hidden footnotes | Conditions that limit specifications |
The Cost of Poor Comparison
| Consequence | Impact |
|---|---|
| Wrong vendor selected | Doesn't meet actual requirements |
| Hidden gaps discovered late | Post-purchase problems |
| Overpaying | Better options not identified |
| Analysis paralysis | Delayed decisions from complexity |
| Inconsistent evaluation | Unfair to some vendors |
Manual Comparison Approach
Step 1: Create Specification List
Before reviewing datasheets, establish what you need to compare:
| Spec Category | Specifications to Compare |
|---|---|
| Physical | Dimensions, weight, mounting, footprint |
| Performance | Speed, capacity, accuracy, throughput |
| Electrical | Power, voltage, current, phase |
| Environmental | Temperature, humidity, IP rating, altitude |
| Compatibility | Interfaces, standards, protocols, connectors |
| Compliance | Certifications, regulatory approvals |
Pro Tip: Start with your requirements, not vendor datasheets. This ensures you're comparing what matters for your application.
Step 2: Create Comparison Matrix
Set up a standardized template with these elements:
- Specification name (exactly as defined in requirements)
- Unit of measurement (standardized)
- Your requirement value (threshold to meet)
- Vendor columns (one per vendor)
- Notes column (for conditions, clarifications)
- Source reference (page and section)
Step 3: Extract from Each Datasheet
- Open datasheet
- For each specification on your list, find the value (if present)
- Note the page/section and record exactly as stated
- Note units and flag if missing
- Document any conditions or footnotes
Step 4: Normalize Data
Convert all values to common units (the full conversion-table reference lives in our unit conversion in procurement guide):
| Raw Data | Normalized |
|---|---|
| 1 inch | 25.4 mm |
| 120 PSI | 8.27 bar |
| 77°F | 25°C |
| 10 HP | 7.457 kW |
| 100 lb | 45.36 kg |
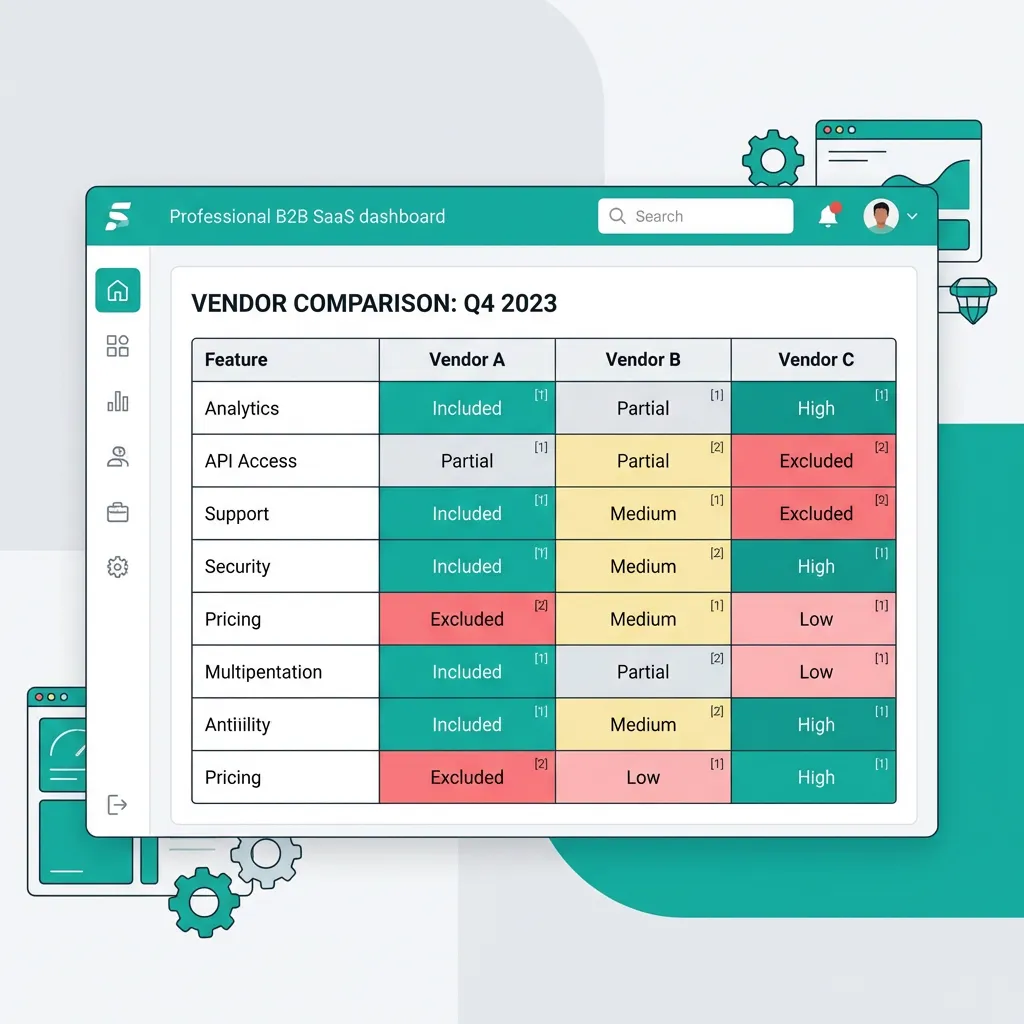
Step 5: Compare and Highlight
| Condition | Highlighting |
|---|---|
| Meets requirement | Green |
| Exceeds requirement | Blue |
| Close to requirement | Yellow |
| Below requirement | Red |
| Missing data | Orange |
Time Required
| Vendors | Specifications | Estimated Time |
|---|---|---|
| 3 | 20 | 3-5 hours |
| 5 | 30 | 6-10 hours |
| 10 | 50 | 15-25 hours |
AI-Powered Comparison Approach
For the full picture of what AI can and can't do here, see AI in Procurement: Complete 2026 Guide and OCR vs AI document analysis. The walkthrough of the actual extraction step is in how SpecLens works.
How AI Accelerates Comparison
| Manual Step | AI Automation |
|---|---|
| Extract from each datasheet | Automatic extraction |
| Create comparison matrix | Auto-generated |
| Normalize units | Automatic conversion |
| Map terminology | Term normalization |
| Identify gaps | Automatic gap detection |
| Highlight differences | Visual comparison |
AI Advantages for Comparison
| Advantage | Benefit |
|---|---|
| Speed | Hours become minutes |
| Consistency | Same extraction every time |
| Completeness | Doesn't get tired or skip sections |
| Scalability | Handle more vendors without proportional time |
| Normalization | Automatic unit conversion |
| Terminology mapping | Understands synonyms |
Time Comparison
| Approach | 5 Vendors × 30 Specs |
|---|---|
| Manual | 6-10 hours |
| AI-assisted | 30-60 minutes |
| Savings | 85-90% |
Building Effective Comparison Matrices
If you'd rather start from a working template, the Specification Compliance Matrix and Quote Comparison Template bake in most of the structure below.
Matrix Structure
| Component | Purpose |
|---|---|
| Specification rows | One row per specification |
| Category grouping | Related specs together |
| Requirement column | Your stated requirement |
| Vendor columns | One per vendor |
| Source reference | Page/section citation |
| Notes column | Conditions, clarifications |
| Compliance indicator | Pass/fail/partial |
Handling Missing Data
| Approach | When to Use |
|---|---|
| Contact vendor | Critical specifications |
| Mark as missing | Document the gap |
| Estimate/research | If industry standards apply |
| Disqualify | If mandatory and not addressed |
| Request demo | Verify through testing |
Common Comparison Mistakes
Comparing Marketing Claims
Problem: Taking marketing statements as specifications.
- "Industry-leading performance" ≠ actual performance metric
- "High efficiency" ≠ efficiency percentage
- "Easy to install" ≠ installation time or requirements
Solution: Compare only quantifiable specifications with units and values.
Ignoring Conditions
Example:
"100 units/hour*" (*under ideal conditions)
"Operating range: -20°C to 50°C (storage), -10°C to 40°C (operating)"
Solution: Read footnotes carefully; document conditions. Compare on the same basis.
Assuming Missing = Zero
Problem: Treating unaddressed specifications as failures.
Reality: May have the specification but didn't include in summary datasheet.
Solution: Request clarification before concluding. Don't penalize for documentation gaps without verification.
The "Apples to Oranges" Problem
📊 Bundle vs. Components
What if Vendor A sells a "System" and Vendor B sells "Components"?
The Solution: Deconstruct to compare. Take Vendor B's base unit + required options + integration labor = "Virtual System."
Never compare a partial solution to a turnkey solution without adjusting.
From Comparison to Decision
The scoring rubric below feeds straight into our wider RFP evaluation matrix — use them together.
Scoring Based on Comparison
| Comparison Result | Suggested Score |
|---|---|
| Exceeds requirement significantly | 5 |
| Exceeds requirement | 4 |
| Meets requirement | 3 |
| Close to requirement | 2 |
| Below requirement | 1 |
| Missing/non-compliant | 0 |
Weighting Specifications
| Weight Level | Apply When |
|---|---|
| High (1.5x) | Specification is critical to function |
| Standard (1.0x) | Normal importance |
| Low (0.5x) | Nice-to-have specification |
| Mandatory | Must be met (pass/fail) |
Industry-Specific Considerations
Manufacturing Equipment
For the full evaluation framework, see our Manufacturing Equipment Buying Guide; for the broader category, manufacturing & industrial procurement.
| Focus Areas | Why |
|---|---|
| Tolerances | Production quality |
| Cycle times | Throughput |
| Tooling compatibility | Integration with existing |
| Maintenance access | Ongoing operation |
IT Hardware
Server, storage, and network selection criteria are covered in our IT Hardware Procurement Guide and IT & data center procurement.
| Focus Areas | Why |
|---|---|
| Compatibility standards | Integration |
| Scalability | Future growth |
| Power/cooling | Data center capacity |
| Management interfaces | Operations |
Transform Your Comparison Process
Vendor datasheet comparison doesn't have to consume hours of manual effort. Structured process—whether manual or AI-assisted—enables objective, thorough vendor evaluation. The economics are quantified in our SpecLens vs Spreadsheets head-to-head, and you can model your own savings with the free Procurement ROI Calculator.
Quote Comparison Template → | Technical Spec Sheet Analysis → | Spec Compliance Verification →
Frequently Asked Questions
Related Articles
Technical Spec Sheet Analysis
Master technical spec sheet analysis for procurement. Extract critical specs, spot gaps, and compare vendor datasheets.
Spec Compliance Verification Guide
Learn how to verify vendor specs actually meet your requirements. Systematic compliance verification for accurate procurement.
Specification Gap Analysis Guide
Learn specification gap analysis to identify missing vendor information. Catch incomplete proposals before they become costly.
Unit Conversion in Procurement
Master unit conversion in procurement to avoid spec mismatches and costly errors. Includes conversion tables and formulas.