Master fleet vehicle procurement. Learn vehicle specs, TCO analysis, EV considerations, and comparison strategies for fleet purchasing.
Fleet vehicles are rolling capital investments that directly impact operational efficiency and total cost of ownership. Whether you're managing delivery vans, service trucks, or sales vehicles, procurement decisions today affect costs and capabilities for years.
This comprehensive guide covers what fleet managers need to know when procuring commercial vehicles—from initial requirements through vendor selection, TCO analysis, and lifecycle management.
Why Fleet Procurement Decisions Matter
The Financial Scale
| Fleet Size | Typical Value | Annual Operating Cost |
|---|
| 10 vehicles | $300K - $600K | $80K - $200K |
| 50 vehicles | $1.5M - $3M | $400K - $1M |
| 100 vehicles | $3M - $6M | $800K - $2M |
| 500 vehicles | $15M - $30M | $4M - $10M |
Operational Impact
| Fleet Factor | Business Impact |
|---|
| Reliability | Service delivery consistency |
| Capability | What work can be performed |
| Capacity | How much can be transported |
| Cost | Operating expense and margins |
| Image | Customer perception |
Fleet Vehicle Categories
Commercial Vehicle Classes
| Class | GVWR (lbs) | Examples | Typical Use |
|---|
| 1 | Up to 6,000 | Passenger cars, small SUVs | Sales, executives |
| 2a | 6,001-8,500 | Large SUVs, small vans | Service, light delivery |
| 2b | 8,501-10,000 | Large pickups, cargo vans | Construction, trades |
| 3 | 10,001-14,000 | Medium vans, small box trucks | Delivery, service |
| 4 | 14,001-16,000 | Large step vans | Package delivery |
| 5-6 | 16,001-26,000 | Bucket trucks, box trucks | Utility, freight |
| 7-8 | 26,001+ | Semis, large trucks | Over-the-road |
Application Types
| Application | Typical Vehicles | Key Requirements |
|---|
| Sales/service | Sedans, small SUVs, vans | Comfort, reliability, professional appearance |
| Delivery (light) | Cargo vans, small trucks | Cargo capacity, maneuverability |
| Field service | Pickups, service bodies | Tool storage, towing, durability |
| Construction | Heavy-duty pickups | Payload, towing, ruggedness |
Critical Specifications
Performance Specifications
| Specification | What to Evaluate | Why It Matters |
|---|
| Engine/motor | Power, torque, fuel type | Work capability, operating cost |
| Transmission | Type, ratios, durability | Efficiency, driver experience |
| Towing capacity | Max trailer weight | Hauling capability |
| Payload | Max cargo weight | What you can carry |
| Cargo volume | Cubic feet available | What will fit |
| Range | Miles per tank/charge | Operational flexibility |
Safety Features
| Category | Features to Evaluate |
|---|
| Standard | Airbags, ABS, stability control |
| Advanced | Forward collision warning, automatic emergency braking |
| Driver assist | Lane keeping, adaptive cruise, blind spot monitoring |
| Fleet-specific | Telematics capability, driver monitoring readiness |
Total Cost of Ownership Analysis
TCO Components
| Cost Component | Typical % of TCO | Key Drivers |
|---|
| Acquisition/depreciation | 30-45% | Purchase price, residual value |
| Fuel/energy | 20-30% | Efficiency, utilization, fuel prices |
| Maintenance/repair | 10-15% | Reliability, preventive maintenance |
| Insurance | 5-10% | Safety features, claims history |
| Administrative | 3-7% | Fleet management overhead |
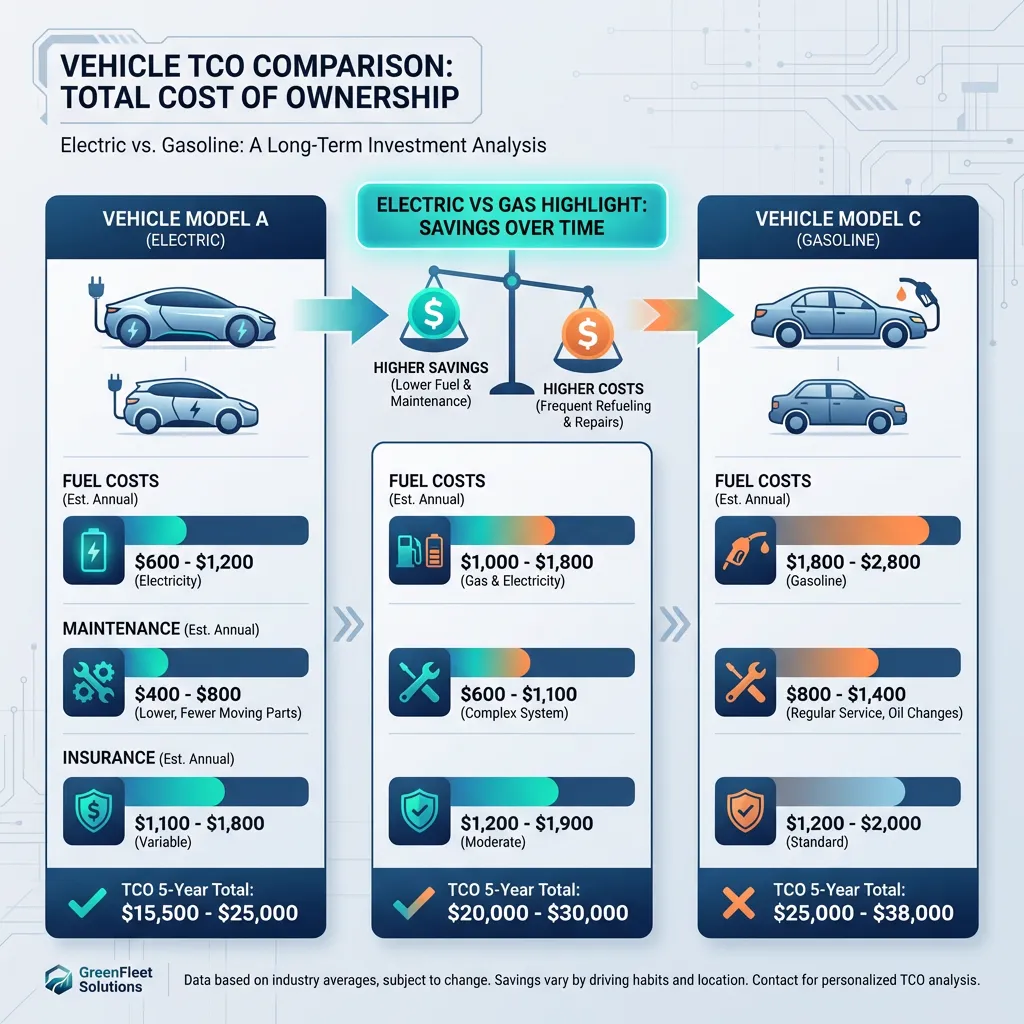
Fuel Cost Comparison Example
| Vehicle | Annual Miles | MPG | Annual Fuel ($4/gal) | 5-Year Fuel |
|---|
| Vehicle A | 25,000 | 22 | $4,545 | $22,727 |
| Vehicle B | 25,000 | 26 | $3,846 | $19,231 |
| Savings | | | $699/year | $3,496 |
Key Insight: Higher-efficiency vehicles cost more upfront but often deliver better total economics.
EV Considerations
When EVs Make Sense
| Factor | Favorable for EV |
|---|
| Route profile | Predictable daily routes within range |
| Base operations | Return-to-base for charging access |
| Duty cycle | Low-speed urban/suburban operation |
| Sustainability | Corporate environmental commitments |
| Incentives | Available federal/state incentives |
Charging Infrastructure Costs
| Infrastructure Item | Typical Cost | Notes |
|---|
| Level 2 charger | $500-$2,500 | Overnight charging |
| Installation | $1,000-$5,000+ | Electrical capacity, permits |
| DCFC (fast charger) | $50,000-$150,000+ | En-route charging |
⚡ EV Range Planning
- EPA ratings are optimistic for commercial use
- Cold weather can reduce range 20-40%
- Payload and accessory use affect range
- Build in 20-30% buffer for real operations
Lease vs. Buy Decision
| Factor | Purchase | Lease |
|---|
| Cash impact | Large upfront or financed | Monthly payments only |
| Ownership | You own the asset | Lessor owns |
| Depreciation risk | Yours | Lessor's |
| Flexibility | You control disposition | Defined lease terms |
| Mileage | No limit | Typically capped |
Buy Case
- High Customization: Specialized upfits that make resale difficult
- High Mileage: Run vehicles 200k+ miles
- Rough Usage: Construction or off-road use
- Capital Available: Want depreciation tax shield
Lease Case
- Cash Preservation: Keep capital for core business
- Predictable Budgeting: Fixed monthly costs
- Newer Fleet: Rotate vehicles every 3-5 years
- Admin Outsourcing: Lease companies handle registration and maintenance
Optimal Vehicle Lifecycle
| Vehicle Type | Typical Optimal Life | Primary Drivers |
|---|
| Light-duty cars | 5-7 years / 80K-120K miles | Maintenance cost curve |
| Light-duty trucks/vans | 6-8 years / 100K-150K miles | Body condition, reliability |
| Medium-duty trucks | 7-10 years / 200K-300K miles | Major component life |
| Heavy-duty trucks | 5-8 years / 500K-1M miles | Engine/transmission rebuild |
Fleet Procurement Checklist
Requirements Definition
- ☐ Operational requirements documented
- ☐ Vehicle type and size requirements defined
- ☐ Utilization projections developed
- ☐ Upfit requirements identified
- ☐ Lease vs. buy analysis completed
Financial Analysis
- ☐ TCO calculated for top candidates
- ☐ Financing terms evaluated
- ☐ Incentives identified
- ☐ Insurance quotes obtained
- ☐ Budget approval secured
Optimize Your Fleet Procurement
Fleet vehicle decisions compound over years of operation. Systematic specification comparison ensures you're optimizing for total cost of ownership, not just acquisition price.
See Logistics Solutions → | Vendor Datasheet Comparison →
Ready to Transform Your Procurement Process?
Try SpecLens today and experience AI-powered specification comparison. Save time, reduce errors, and make better purchasing decisions.